Mauna Loa is stirring. Is a major eruption imminent?
Here a comparisons with previous eruptions.
Mauna Loa is showing persistent signs of volcanic unrest. Since 2014, increased seismicity and deformation indicate that Mauna Loa, the volcano that dominates more than half of the island of Hawaiʻi, may be building toward its first eruption since 1984.
Thousands of residents and key infrastructure are potentially at risk from lava flows, so a critical question is whether the volcano will follow patterns of previous eruptions or return to its now historically unprecedented 33-year slumber.
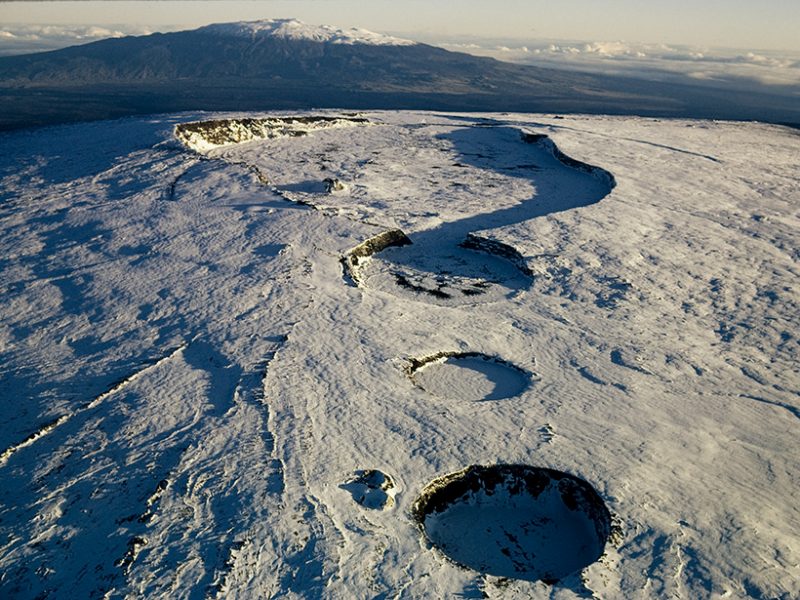
Mauna Loa has erupted 33 times since 1843, an average of one eruption every 5 years. Typical of shield-building Hawaiian volcanoes, Mauna Loa hosts a summit caldera and two rift zones, the Northeast Rift Zone (NERZ) and the Southwest Rift Zone (SWRZ).
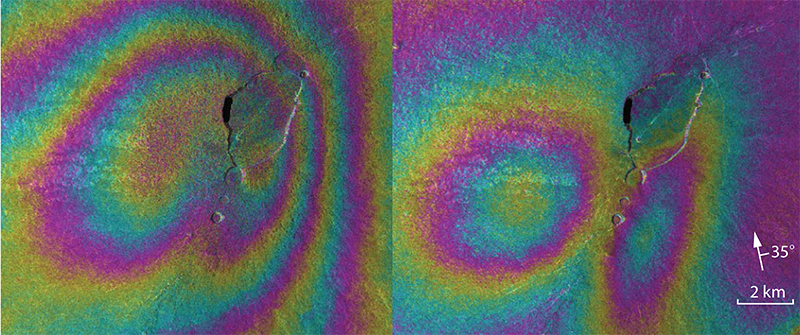
Since the two most recent eruptions, in 1975 and 1984, monitoring by the U.S. Geological Survey’s Hawaiian Volcano Observatory has changed dramatically. Ground-based instruments continuously record signals from global navigation satellite systems (GNSS, of which GPS is one example), measuring the changing shape of the ground surface in near-real time, and interferometric synthetic aperture radar (InSAR) provides extensive spatial coverage of deformation. Seismic monitoring has also improved with the addition of more stations, increased data fidelity, and improved data analysis.
More people live on the slopes of Mauna Loa now than in the 1970s and 1980s, so improvements in monitoring technology are of more than just academic interest.
How does this recent period of unrest compare with the periods just before previous eruptions? How reliable are these comparisons in predicting the next eruption?
The Current Unrest
Several periods of unrest have occurred at Mauna Loa since the 1984 eruption. The shallow magma storage complex started refilling (inflating) immediately following the eruption, but inflation soon slowed, and stopped altogether in the mid-1990s. A short-lived inflation episode began in 2002 , and another began in 2004. By 2009, inflation had largely ceased. Unlike the current unrest, these previous two inflation episodes were not associated with significant numbers of shallow earthquakes; rather, they started with brief periods of deep seismicity approximately 45 kilometers beneath the surface.
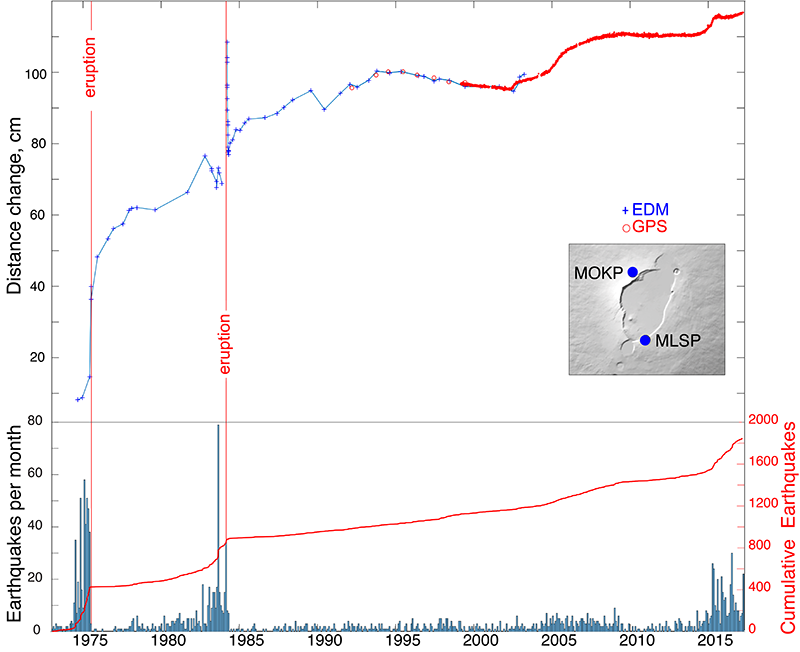
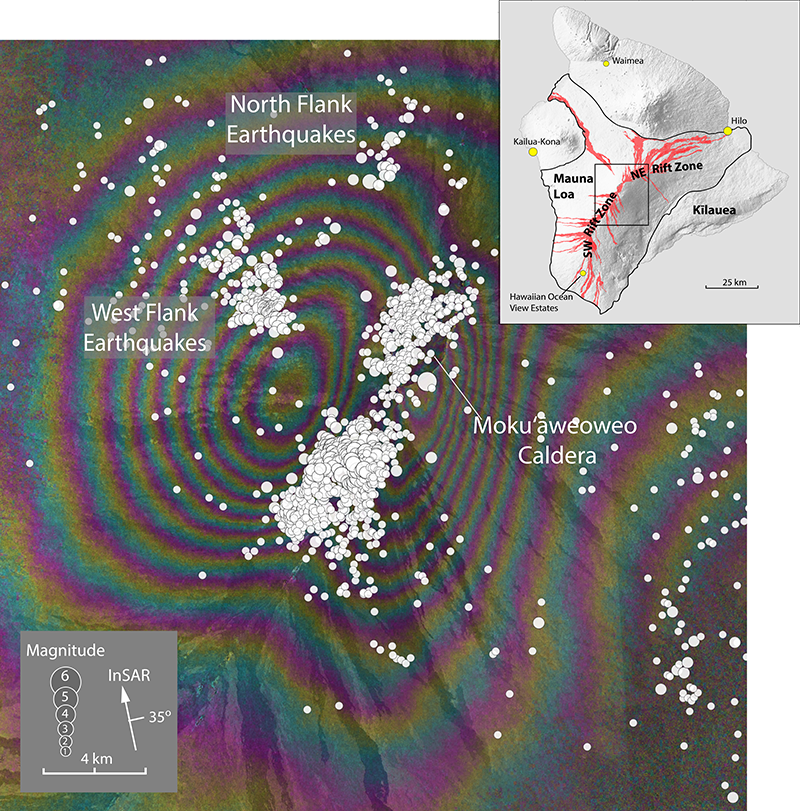
The current unrest started in earnest in 2014. Seismicity rates began to rise above background levels as early as March 2013, and by summer 2014, both seismicity and deformation rates had increased significantly. The pattern of ground deformation indicated inflation of a magma storage complex beneath the caldera and uppermost SWRZ, areas that were also the most seismically active.
Beneath the caldera, seismicity consists of mostly small earthquakes (magnitude M of less than 2.5) at depths of 2–3 kilometers. These earthquakes occur in swarms lasting days to weeks, separated by months of minor activity. Event rates have been as high as 15 earthquakes per hour, with most earthquakes too small to be formally located.
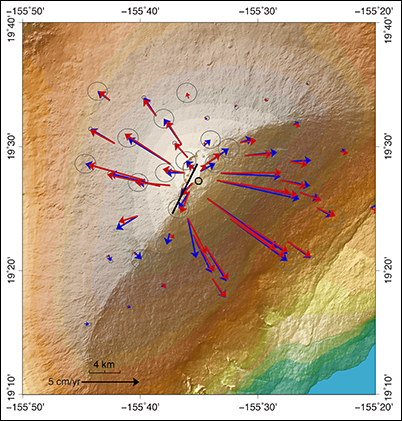
Average horizontal velocities of GNSS stations on Mauna Loa from mid-2014 through 2016.
The uppermost SWRZ has been the most seismically active region during the current unrest, in terms of overall energy release and number of earthquakes. These earthquakes are typically 3–4 kilometers below the surface. Another area of seismicity has been high on the west flank of the volcano, where swarms of small earthquakes (mostly less than M2.5) at an average depth of about 7 kilometers typically last days to a week.
In addition to shallow seismicity, there have been several deep (greater than 20 kilometers), long-period earthquakes loosely scattered beneath the summit area. During previous periods of inflation, earthquakes with similar characteristics have been associated with magma ascent.
Short-term rates of seismicity and deformation have varied in magnitude, with weeklong to monthlong periods of relative quiescence interspersed within longer-term trends of heightened activity. Although there is general long-term correlation between deformation and seismicity rates, there is no obvious relationship between them in the short term.
The spatial pattern of deformation and seismicity has also varied. In fall 2015, after several months of decreased inflation at the summit, seismicity beneath the caldera largely ceased, and inflation in the upper SWRZ increased. In May 2016, inflation and seismicity beneath the caldera slowly resumed, but as of mid-2017, rates are low compared with those seen prior to fall 2015.
Comparison with Past Eruptions
Deformation monitoring networks in place before the 1975 and 1984 eruptions were sufficient to provide long-term indications of inflation that along with increased seismicity, led to a general forecast for the 1984 eruption. However, measurements were not frequent enough to evaluate whether there were precursory changes in extension or uplift in the summit area just prior to eruption.
Direct comparison of magma storage geometries and volumes derived from deformation patterns is also not possible because of the limited spatial and temporal extent of the early geodetic monitoring networks. Pre-1984 measurements are consistent with, but cannot confirm, the existence of a large-volume tabular storage complex (a vertical, dikelike body) beneath the summit and upper SWRZ, similar to what we currently model from GNSS and InSAR data.
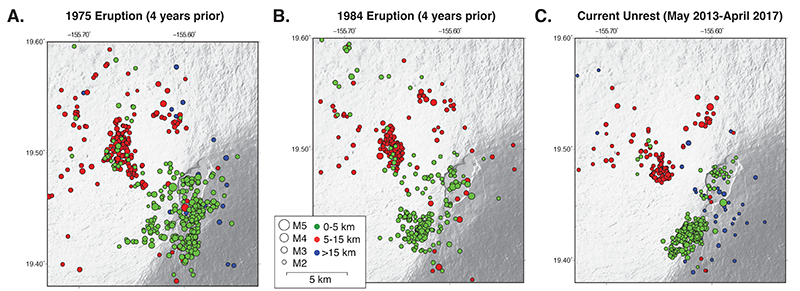
Similarly, differences in seismic network sensitivity and data processing preclude direct comparison of current seismicity rates with pre-1975 and pre-1984 rates. Patterns in the locations of earthquakes stronger than about M1.7, however, are comparable, and these patterns show a clear coincidence between the locations of seismicity during the current unrest and previous preeruption patterns.
Another approach to comparing precursory seismicity is to evaluate cumulative seismic energy release, which mainly reflects energy released by larger-magnitude earthquakes (energy release increases logarithmically with respect to earthquake magnitude). Between 1 May 2013 and 30 April 2017, energy release on the west flank was equivalent to an M4.1 earthquake. For the same region, energy releases during the 4 years prior to the 1975 and 1984 eruptions were M4.2 and M4.5, respectively. In the caldera and uppermost SWRZ, the current energy release sums to M4.4, compared with M4.9 and M4.4 for the 1975 and 1984 precursory periods.
Energy release may indicate whether a period of unrest results in an eruption, but this relationship has not been established on shield volcanoes such as Mauna Loa.Thus, the energy released during the current 4 or so years of unrest is approaching that released during the 4 years prior to the 1975 and 1984 eruptions. In some volcanic systems, the amount of energy release compared with previous eruptions may be an indicator of whether a period of unrest results in an eruption, but this relationship has not been established on shield volcanoes such as Mauna Loa.
One to 2 years prior to the 1975 and 1984 eruptions, swarms of small earthquakes increased in intensity. The strongest swarms included hundreds of small earthquakes per day for weeks. Bursts, as they were called, were separated by 3–6 months of relative quiet. Recently, swarms on the west flank have increased in number and size, but the durations of the swarms are less than pre-1975 and 1984 levels. Similarly, swarms of tiny earthquakes beneath the caldera have not occurred at rates seen in the months prior to the 1975 and 1984 eruptions.
Interestingly, during the days to weeks prior to the past two eruptions, the number of small earthquakes fluctuated instead of building up steadily, even reaching relatively low rates for short periods prior to eruption. However, both eruptions had distinct short-term seismic precursors. The 1975 eruption was preceded by less than an hour of strong tremor in the summit caldera area. In 1984, small (less than M0.1) earthquakes increased in frequency, shaking the ground two or three times per minute about 2.5 hours before the eruption. Harmonic tremor began about 2 hours prior to eruption, with a large increase in tremor amplitude and a swarm of earthquakes 30 minutes prior to eruption. Seven earthquakes larger than M3 occurred during a period from 30 minutes before the 1984 eruption until just over 1 hour after the onset of the eruption.
Is an Eruption in Our Near Future?
Mauna Loa’s long history of observed activity aids in forecasting another eruption, but at present, any forecast still contains a high degree of uncertainty. Mauna Loa’s long history of observed activity aids in forecasting another eruption, but at present, any forecast still contains a high degree of uncertainty. Some aspects of the current unrest are similar to unrest prior to eruptions in 1975 and 1984. Earthquake locations, temporal behavior, and energy release suggest that the volcano may be following a similar pattern.
Other aspects, however, differ from the periods prior to the 1975 and 1984 eruptions. During the current unrest period, we have not observed the kind of moderate to large flank earthquakes that preceded many historical eruptions, including the 1975 and 1984 eruptions. Also, as of fall 2017, we have not seen the high rates of small earthquakes observed about 7–14 months prior to the 1975 and 1984 eruptions, even though our ability to detect them has improved. Thus, if current unrest follows previous patterns of seismicity, we may expect that the volcano is still many months from eruption.
We must also consider that current unrest might not follow previous patterns, and an eruption could occur without months of elevated microseismicity. It is possible that after years of intermittent inflation, shallow magma storage is exerting pressures already near the breaking point of the overlying rock.
We can’t say for certain whether there will be a precursory months-long increase in microseismicity before the next Mauna Loa eruption. However, an eruption will likely be immediately preceded by an hours-long, dramatic increase in small earthquakes (at least one earthquake per minute), strong tremor, and the occurrence of several M3 or stronger earthquakes, similar to the lead-up to the 1975 and 1984 eruptions. Real-time deformation data from tiltmeters and GNSS stations will show large anomalies as magma moves from storage reservoirs toward the surface to the eventual eruption site in the summit area and/or along one of the rift zones or (less likely) from radial vents on the west flank.
It is also possible that current elevated rates of seismicity and deformation may not culminate in eruption anytime soon; rather, this could be yet another episode of unrest that gradually diminishes. During the 25-year repose between the 1950 and 1975 eruptions, seismic unrest in 1962, 1967, and 1970 did not lead to eruption, although in hindsight, each is considered a long-term precursor to the 1975 eruption.
The high rate of volcanic activity at neighboring Kīlauea volcano complicates assessing the likelihood of a Mauna Loa eruption in the coming months or years. Klein noted that longer repose intervals at Mauna Loa were statistically correlated with eruptive activity at Kīlauea. Indeed, the current long repose time at Mauna Loa is occurring at the same time as the long-lived Puʻu ʻŌʻō eruption at Kīlauea, which began in 1983 and continues today. Even so, the most recent eruption of Mauna Loa in 1984 occurred during this eruption at Kīlauea, so the impact of nearby volcanic activity on Mauna Loa’s behavior over short timescales is unknown.
We can make one forecast with relative certainty: On the basis of nearly 200 years of documented activity, it is highly likely that the next eruption will begin in the summit region and then, within days to years, migrate into one of the two primary rift zones.
It is important to note that seismicity and inflation beneath the uppermost SWRZ do not imply an increased likelihood of eruption along the SWRZ. Similar patterns of seismicity prior to the 1975 and 1984 eruptions did not result in sustained activity in the SWRZ. In 1984, the eruption began at the summit and migrated to the upper SWRZ before activity focused along the NERZ, suggesting that a magma body extending into the uppermost SWRZ—similar to that inferred from current data—was also active prior to that eruption.
Communicating the Hazards
In response to more than a year of persistently elevated rates of seismicity and deformation, the Hawaiian Volcano Observatory (HVO) elevated the Volcano Alert Level and Aviation Color Code for Mauna Loa to advisory/yellow on 17 September 2015, indicating that the volcano was restless and that monitoring parameters were above the long-term background levels.
As with any precursory volcanic eruption sequence, it will be challenging to choose the correct time to alert authorities and elevate public concern about a possible eruption. Once an eruption has commenced, pinpointing the exact location of the outbreak—especially at night or in cloudy conditions—may not be straightforward and may require the use of new tools such as infrasound. Vent location determines which downslope areas are at greatest risk, so addressing this capability gap is a high priority.
As of this writing, elevated rates of seismicity and deformation continue. Additional efforts to inform and prepare the public for the eventual eruption are an important step in minimizing impacts to life and property.
Reference
Walter, T. R., and F. Amelung (2006), Volcano-earthquake interaction at Mauna Loa volcano, Hawaii, J. Geophys. Res., 111, B05204, https://doi.org/10.1029/2005JB003861.
Decker, R. W., et al. (1983), Seismicity and surface deformation of Mauna Loa volcano, Hawaii, Eos Trans. AGU, 64(37), 545–547, https://doi.org/10.1029/EO064i037p00545-01.
Klein, F. W. (1982), Patterns of historical eruptions at Hawaiian volcanoes, J. Volcanol. Geotherm. Res., 12, 1–35, https://doi.org/10.1016/0377-0273(82)90002-6.
Koyanagi, R. Y. (1987), Seismicity associated with volcanism in Hawaii: Application to the 1984 eruption of Mauna Loa volcano, U.S. Geol. Surv. Open File Rep., 87-277, 76 pp.
Koyanagi, R. Y., E. T. Endo, and J. S. Ebisu (1975), Reawakening of Mauna Loa volcano, Hawaii: A preliminary evaluation of seismic evidence, Geophys. Res. Lett., 2(9), 405–408, https://doi.org/10.1029/GL002i009p00405.
Lockwood, J. P., et al. (1987), Mauna Loa 1974–1984: A decade of intrusive and extrusive activity, in Volcanism in Hawaii,chap. 19, U.S. Geol. Surv. Prof. Pap., 1350, 537–570.
Miklius, A., and P. Cervelli (2003), Interaction between Kīlauea and Mauna Loa, Nature, 421, 229, https://doi.org/10.1038/421229a.
Okubo, P. G., and C. J. Wolfe (2008), Swarms of similar long-period earthquakes in the mantle beneath Mauna Loa volcano, J. Volcanol. Geotherm. Res., 178, 787–794, https://doi.org/10.1016/j.jvolgeores.2008.09.007.
Thelen, W. A., S. D. Malone, and M. E. West (2010), Repose time and cumulative moment magnitude: A new tool for forecasting eruptions?, Geophys. Res. Lett., 37, L18301, https://doi.org/10.1029/2010GL044194.
Trusdell, F. A. (2012), Mauna Loa—History, hazards, and risk of living with the world’s largest volcano, U.S. Geol. Surv. Fact Sheet, 2012-3104, 4 pp., https://pubs.usgs.gov/fs/2012/3104/.
Walter, T. R., and F. Amelung (2006), Volcano-earthquake interaction at Mauna Loa volcano, Hawaii, J. Geophys. Res., 111,B05204, https://doi.org/10.1029/2005JB003861.
Follow us: Facebook and Twitter
EOS – Volcanic Unrest at Mauna Loa, Earth’s Largest Active Volcano


This is not the worlds largest volcano
http://www.pbs.org/newshour/rundown/the-largest-volcano-on-earth-discovered-beneath-the-pacific-ocean/
[…] https://strangesounds.org/2017/10/mauna-loa-volcanic-unrest-major-eruption-imminent.html […]