The noise created by the Earth’s movements has been used to build up a detailed picture of the geological conditions beneath the Greenland Ice Sheet and the impact on ice flow, in new research.
Scientists found:
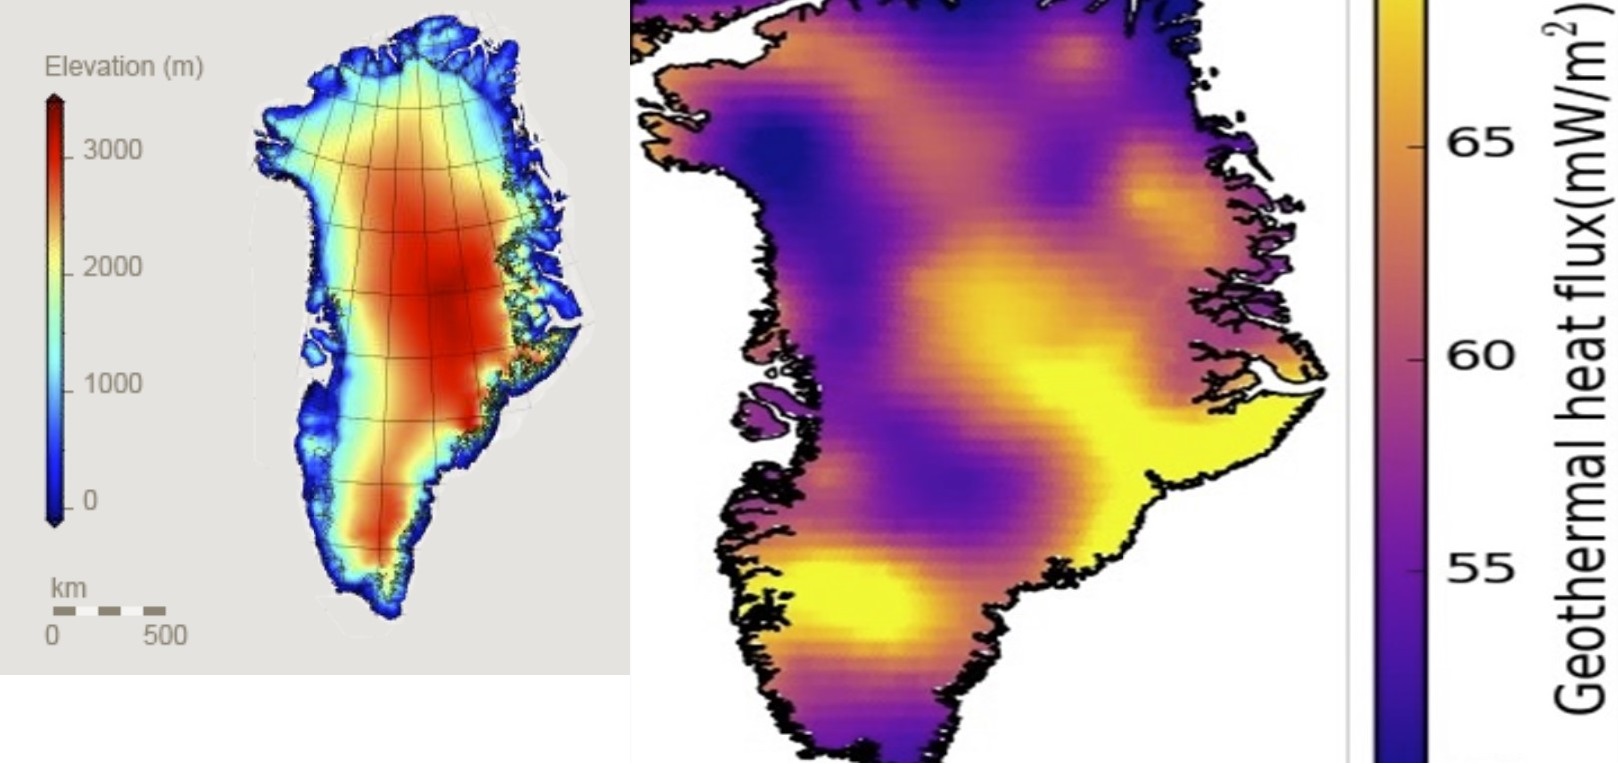
- Regions of high geothermal heat concurrent with the proposed historical location of the Iceland hotspot track
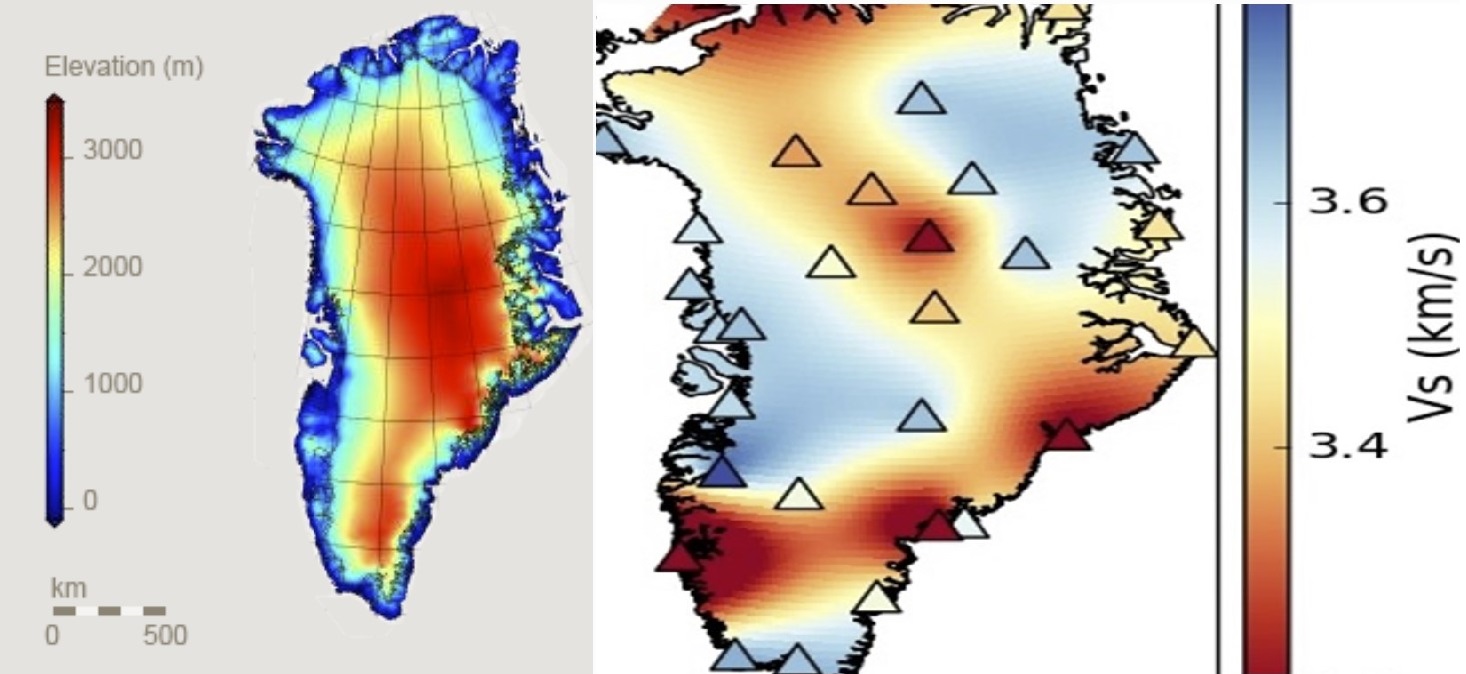
- Soft sedimentary substrates beneath major fast flowing outlet glaciers, revealed by lower wave speeds
- Some outlet glaciers are particularly susceptible to basal slip, including Jakobshavn, Helheim and Kangerdlussuaq
- Geothermal warming and softening of basal ice may affect the onset of faster ice flow at Petermann Glacier and the Northeast Greenland Ice Stream.
The team studied Rayleigh waves – seismic waves generated by movements such as earthquakes – to produce high-resolution images of the rocks underneath the ice sheet, helping to identify which areas are most susceptible to faster ice flow.
The Greenland Ice Sheet is the second largest reservoir of freshwater on Earth. However, the rate of loss of ice mass from the ice sheet has increased six-fold since 1991, which accounts for around 10% of the recent rise in global sea levels.
The geological conditions in the ground beneath an ice sheet or glacier play a key role in determining ice flow. Key factors include: the make-up of the layers of rock; the temperature of the earth’s crust beneath; and the amount of water present in liquid form between rock and ice as this acts as a lubricant, causing so-called “basal slip” and speeding up the flow of ice.
The problem, however, is how to assess what is happening deep underground, given the remoteness of Greenland and the fact that the ground is covered with ice approximately 2.5 kilometres thick.
In 2009, a permanent network of seismic monitoring stations was installed across Greenland, which have been used in previous research. However, these studies have offered limited insight on the geological controls on the ice sheet.
This is where the new research comes in. The team were able to map out what is happening down as far as 5 kilometers by measuring Rayleigh waves extracted from the Earth’s noise. These seismic waves travel along the Earth’s surface and are sensitive to variations in Earth’s properties.
By measuring the speed, shape and duration of the waves, researchers are able to work out what material they are travelling through: the mechanical properties of the rocks, such as rigidity and density; the layering of the rocks and the physical properties of the surface soil.
Rayleigh waves travel in an elliptical pattern and the specific feature that the researchers assessed was the horizontal to vertical ratio of particle motion within the waves.
They found:
- Regions of high geothermal heat concurrent with the proposed historical location of the Iceland hotspot track
- Soft sedimentary substrates beneath major fast flowing outlet glaciers, revealed by lower wave speeds
- Some outlet glaciers are particularly susceptible to basal slip, including Jakobshavn, Helheim and Kangerdlussuaq
- Geothermal warming and softening of basal ice may affect the onset of faster ice flow at Petermann Glacier and the Northeast Greenland Ice Stream.
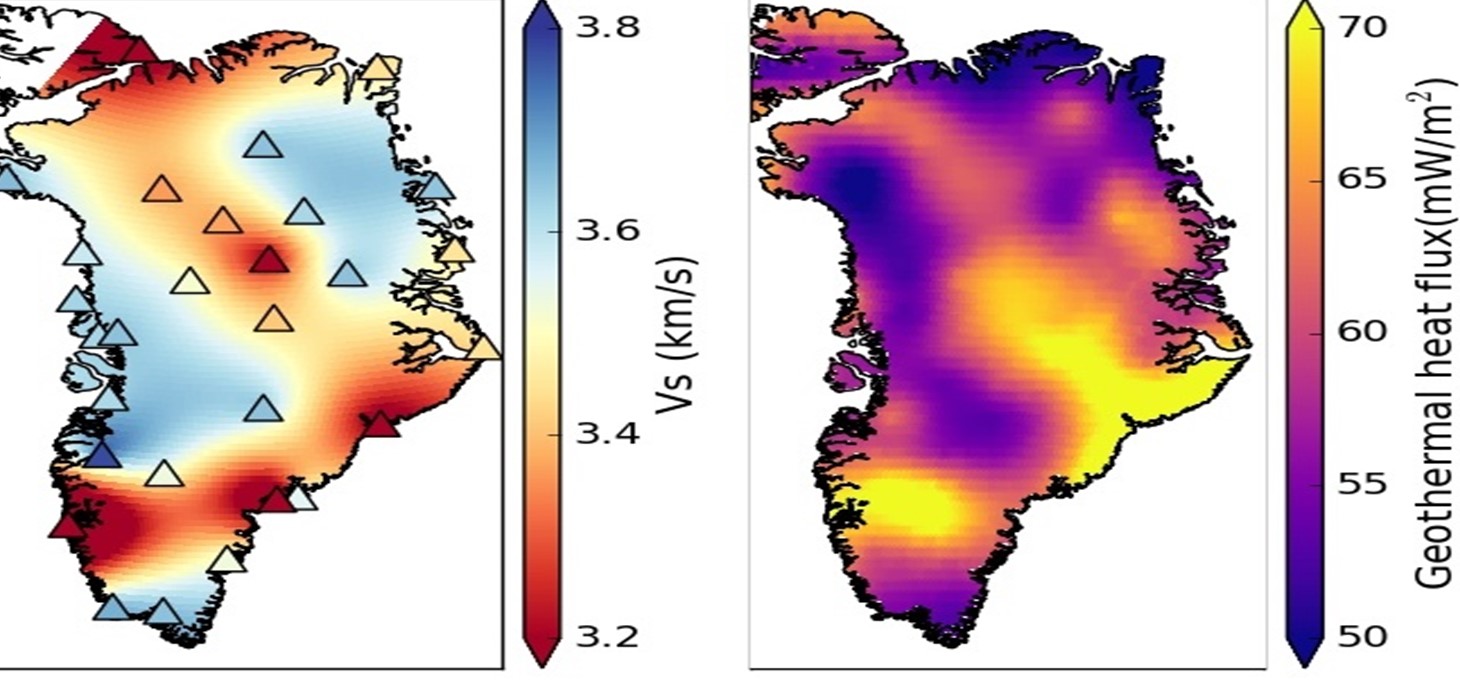
Now if you compare the new geothermal heat map beneath the ice sheet of Greenland with that of the glacier melting, you clearly see a positive correlation (areas of geothermal activity show increased ice lost)!
Same conclusion if you compare the amount of ice lost and the Rayleigh wave speed 4km beneath the ice, where slower underground seismic wave speed is associated with hotter areas.
“This research highlights the importance of the coupling between the solid earth and ice sheet dynamics. Interactions with the solid earth control the past, present and future dynamics of the Greenland Ice Sheet.
Our technique using the elliptical shape of Rayleigh waves means we can build up a more detailed picture than before of the structure of the upper 5 km beneath the ice sheet.
It will give us a better understanding of the processes that contribute to accelerated ice discharge into the ocean and the consequent sea level rise.” [Nature, Swansea.uk.edu]
So yes! Geology is king! And, in the case of Greenland, it clearly indicates that melting occurs from below (rocks, geothermal heating), thus contradicting the false narratives of the global warming propaganda!
Now subscribe to this blog to get more amazing news curated just for you right in your inbox on a daily basis (here an example of our new newsletter).
You can also follow us on Facebook and/ or Twitter. And, by the way you can also make a donation through Paypal. Thank you!
You should really subscribe to QFiles. You will get very interesting information about strange events around the world.


The funny part is lefty heads exploding that it is NOT global warming. I find this very amusing, and excellent ammo to use when arguing with these mind controlled imbeciles.
But at this point, we don’t yet know how much of the melting is due to the geothermal activity and this article doesn’t say.
2009 reports are still accurate and concurrent?
Merry Christmas, Alex. Have you fed any tyrants to the crocodiles in Australia?
??
Merry Christmas to Mo, my favorite convert. He has been hiding lately?