As Joe Hanson points out in the latest episode of “It’s Okay to Be Smart,” wind can be as destructive and powerful, cold as it is beautiful. But it’s not often we stop to think about the origins of this powerful, planet-shaping force.
Wind can be destructive:
Six decades of U.S. tornadoes visualized in one stunning map

Using almost sixty years’ worth of data from NOAA, designer John Nelson has produced a mesmerizing visualization of tornado activity in the United States. Ever wondered where “Tornado Alley” got its name? Wonder no more.
Writes Nelson:
“Got this data from NOAA via the spectacular Data.gov. It tracks 56 years of tornado paths along with a host of attribute information. Here, the tracks are categorized by their F-Scale, where brighter strokes represent more violent storms.”
The F-scale Nelson is referring to is the Fujita scale, which ranks tornados according to windspeed and destructive potential on a six-point scale ranging from F0 (40–72 mph winds and a few broken tree branches) to F5 (261+ mph winds and holy crap flying semi trucks).

Things get even more interesting when Nelson splits the visualization across six separate maps according to F-Scale. As much as I like the first map for its all-encompassing, almost overwhelming quality, seeing the tornadoes spread out according to severity helps illustrate how common (or uncommon) they actually are. It makes identifying their geographical impact more manageable as well, helping illustrate something we brought up earlier this week: for as common as tornadoes seem, your chances of coming face-to-face with a house-leveling twister are actually pretty slim — even in tornado alley.
Wind can be beautiful
A mesmerizing, real-time map of US wind patterns
It’s all possible thanks to a smart piece of data visualization called, quite simply, “Wind Map.” Bear in mind that the picture up top is just a screenshot; for the full-blown experience, you really need to click through to the actual Wind Map website, where you can watch data collected from the National Digital Forecast Database take shape in the form of stunning, swirling patterns of aeolian goodness.
Wind as a planet shaping force
Wind Battered Landscape from Mars

Who would ever imagine that sand dunes could look so incredible? In this beautiful image, sand trapped in an impact crater in the Red Planet’s Moachis Terra region have been sculpted by the winds of Mars into a vast and variegated landscape.
More than 21,000 images have been captured by Nasa’ HiRISE telescope since it began taking photos of the Red Planet’s surface in late 2006. Photos like the one up top are of particular interest to scientists studying what are known as “aeolian processes” — i.e. the study of landforms formed by wind (Aeolus is the wind god in Greek mythology).
Earth Changes
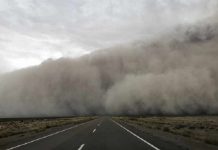
Dust storms will rise in the American West

People living in Colorado, Utah, and other western states in the U.S. often remark that there seem to be a lot more dust storms these days. But is it true? One geology researcher wanted to find out. What she discovered may make you want to get a dust-filtration mask for the coming decade.
According to a release from the University of Colorado at Boulder:
“Dust storms cause a large-scale reorganization of nutrients on the surface of the Earth,” said Janice Brahney, who led the study as a CU-Boulder doctoral student. “And we don’t routinely monitor dust in most places, which means we don’t have a good handle on how the material is moving, when it’s moving and where it’s going.”
Based on anecdotal evidence, such as incidents of dust coating the snowpack in the southern Rockies and a seemingly greater number of dust storms noticed by Western residents, scientists have suspected that dust emissions were increasing. But because dust has not been routinely measured over long periods of time, it was difficult to say for sure . . .
For the new study, recently published online in the journal Aeolian Research, the research team set out to determine if they could use calcium deposition as a proxy for dust measurements. Calcium can make its way into the atmosphere — before falling back to earth along with precipitation — through a number of avenues, including coal-fired power plants, forest fires, ocean spray and, key to this study, wind erosion of soils.
The amount of calcium dissolved in precipitation has long been measured by the National Atmospheric Deposition Program, or NADP, which first began recording the chemicals dissolved in precipitation in the late 1970s to better understand the phenomena of acid rain.
Brahney and her colleagues reviewed calcium deposition data from 175 NADP sites across the United States between 1994 and 2010, and they found that calcium deposition had increased at 116 of them. The sites with the greatest increases were clustered in the Northwest, the Midwest and the Intermountain West, with Colorado, Wyoming and Utah seeing especially large increases.
You can read more via University of Colorado, and read the full scientific paper via Aeolian Research.
Follow us: Facebook and Twitter


