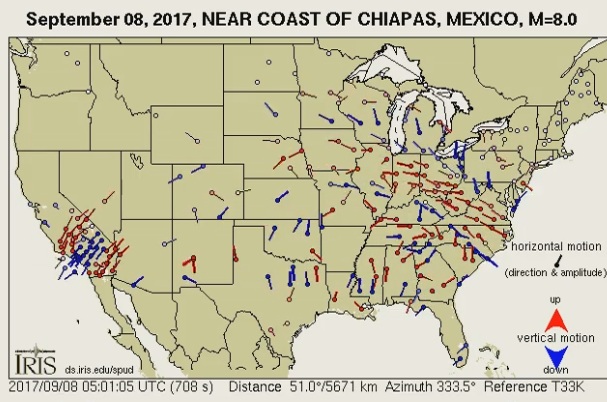
Ever wondered how the M8.1 earthquake travelled across the USA?
Well look at the pretty impressive video below:
What you see here are seismic waves from the earthquake in Mexico moving seismic stations in the US (each dot is a station). Red means the station is moving up and blue means the station is moving down. The spinning lines show the direction and size of other motions.
In more scientific – complicate – words: The USArray Ground Motion Visualization (GMV) is a video-based IRIS DMC product that illustrates how seismic waves travel away from an earthquake location by depicting the normalized recorded wave amplitudes at each seismometer location using colored symbols. The color of each symbol depicts the amplitude of the vertical ground motion, as detected by the station’s seismometer and normalized to its peak amplitude. The color changes as waves of differing amplitude travel past the seismometer. Blue indicates downward ground motion while red represents upward ground motion with the darker colors indicating larger amplitudes.

Although you probably didn’t understand totally the second explanation – me neither – the video of the waves developping across the USA is just so impressive.


