 This USGS data animation shows the unprecedent increase in earthquakes (>3.0M) in the Oklahoma areas where hydraulic fracturing for gas and oil is currently booming.

The rate has gone from an average of 1.5 a year to 2.5 a day! Incredible
Here an excerpt of a Statement on Oklahoma Seismicity by The Oklahoma Geological Survey:
[quote_box_center]The rate of magnitude 3+ earthquakes has increased from 1.5 per year prior to 2008 to the current average rate of 2.5 per day, a rate that is approximately 600 times the historical background.
The Oklahoma Geological Survey (OGS) considers it very likely that the majority of recent earthquakes, particularly those in central and north-central Oklahoma, are triggered by the injection of produced water in disposal wells.
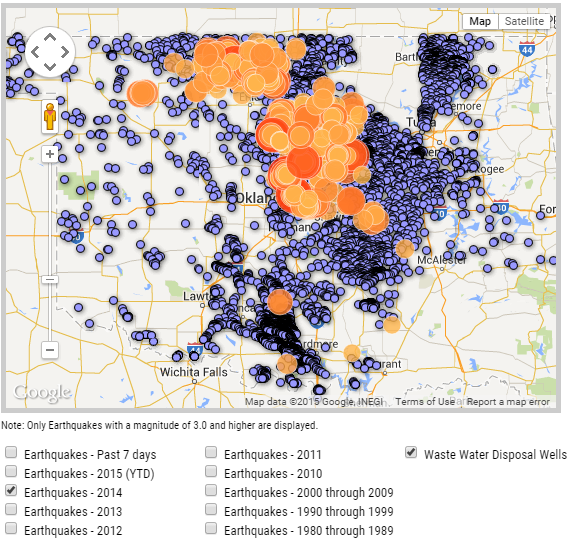
The primary source for suspected triggered seismicity is not from hydraulic fracturing, but from the injection/disposal of water associated with oil and gas production. Produced water is naturally occurring water within the Earth that is often high in salinity and co-exists with oil and gas in the subsurface. As the oil and gas is extracted/produced, so is the water. This water is then separated from the oil and gas and re-injected into disposal wells, often at greater depth from which is was produced…[/quote_box_center]
The end of this video is just crazy! Explosive!


 in the Oklahoma areas where hydraulic fracturing for gas and oil is currently booming.)